1

Regarding Difference-in-Difference, I saw a lot of discussions saying that the treatment will receive the value of 1 if on the event day. However, from this paper of Dasgupta,2019, I am wondering if they use the data of the observations on the event day.

I asked this question because in their paper, they did not mention clearly whether they use the data on event day in their study. What they said from section 3.1 is

Figure 1 plots the mean of the mean change in asset growth of treated firms and control firms in the same industry, 2 years before and 5 years after the adoption of a leniency law in a country. Thus, the control firms are all firms in the same industry in countries that had not passed a leniency law in the 7 years surrounding the event date.

I am wondering why they say "7 years surrounding the event"? Whether "surrounding the event date" includes the event date?

For clarifying the question, for example:

If Korea passed the law in 1997, so the treatment including Korean firms in 1995,1996,1997,1998,1999,2000,2001 and the Korean firms in 1997,1998,1999,2000,2001 will receive the value of 1 (post x treatment)

or

the treatment including Korean firms in 1995,1996,1998,1999,2000,2001,2002 and the Korean firms in 1998,1999,2000,2001,2002 will receive the value of 1 (post x treatment)

2
  • 1
    Can't you check the plot to see what dates are included?
    – E.Aigle
    Commented May 27, 2021 at 11:49
  • 2
    I think this is a very strange mixture of statistics / "mathematical" language and "natural" language. Possibly deliberately set up to mislead. The reference to countries that had not passed a leniency law in the 7 years surrounding the event date could cover a number of different scenarios. Say the "event" was in 2010, and countries A and B passed relevant laws in 2009 and 2011 respectively. They could both still count as "control" data sources, if A didn't pass any more such laws until 2016, and B didn't do so until 2018. But what would that mean, statistically speaking? Commented May 27, 2021 at 12:52

1 Answer 1

2

It might be helpful to really understand what a "difference-in-differences" analysis is - this article has a good explanation: Introduction to Difference-in-Differences Estimation

The DD model includes several pieces:

  • A sudden exogenous source of variation, which we will refer to as the treatment. Treatment examples include changes in minimum wage, a new workplace non-discrimination policy, or a new CO2 emissions tax.
  • A quantifiable and measurable outcome which is either the direct target of the variation or an indirect proxy.
  • A treatment group which is subjected to the change.
  • A control group which is similar in characteristic to the treatment group but is not subjected to the change.

Because the measurement occurs over time and you want it to be relative to companies that have not be subjected to the change, it is obvious that "surrounding" includes the event date. The "7 years surrounding the event date" have already been described by "2 years before and 5 years after the adoption of a leniency law in a country".

The control group are companies that did not experience "the adoption of a leniency law in a country" (the treatment) in that time period. If they had experienced an event during that time, they couldn't be used to measure what might have happened if the treatment had not occurred. It's important to analyze some time before the event in addition to time after the event, so that we can see how each group is related before the event we want to study happens.

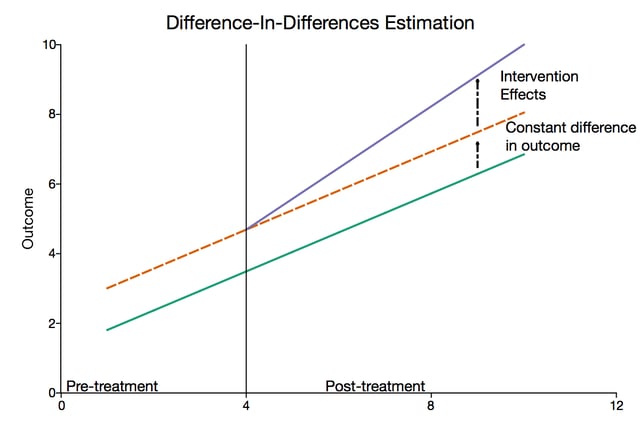
An example chart looks like this:

example difference-in-differences estimation chart

The event is a single point that separates "pre-treatment" and "post-treatment".

4
  • so, you mean, in my case, it should be 1995,1996,1997,1998,1999,2000,2001 ? Please correct me if I get you wrong. But you can see "2 years before and 5 years after the adoption of a leniency law in a country". So the event year is classified in "before" or "after" please? Commented May 27, 2021 at 21:38
  • @BeautifulMindset The plot has two years before the event, and seven years after the event. The event happened at one point in time, it didn't take an entire year to happen, so your question doesn't make sense to me. The chart should cover 9 years total and have a marker showing where the event occurred.
    – ColleenV
    Commented May 27, 2021 at 21:46
  • Colleen V: I understand what you mean, but in many international finance studies, we do not know the exact day but we use the year as the event year. This is what confused me. But I understand more from your clarification. Thank you. Commented May 27, 2021 at 21:54
  • 1
    @BeautifulMindset Actually, it does matter depending on what metric they're using to measure the effect. If the data is only available over an entire year, you would probably have to account for the portion of the year the treatment was in effect, or skip the year entirely in the analysis. I don't really know the economic analysis well enough to go much deeper than that.
    – ColleenV
    Commented May 27, 2021 at 21:56

You must log in to answer this question.

Not the answer you're looking for? Browse other questions tagged .